HBAR Price Retests Fibonacci Support as Bullish Volume Builds
HBAR price finds crucial Fibonacci support as trading volume surges. Technical analysis reveals bullish momentum building for Hedera.
The HBAR price’s Fibonacci support level has emerged as a critical battleground where bulls and bears are currently engaged in a decisive struggle. As trading activity intensifies and volume metrics paint an increasingly optimistic picture, market participants are closely monitoring whether this technical setup will catalyze the next major upward movement. The convergence of classical technical analysis patterns with mounting on-chain metrics suggests that HBAR price may be positioning itself for a substantial breakout, making this an opportune moment to examine the underlying dynamics driving this cryptocurrency’s trajectory.
Fibonacci Retracement Levels in HBAR Price Analysis
Fibonacci retracement has long served as one of the most reliable technical analysis tools in financial markets, and its application to cryptocurrency trading has proven equally valuable. The HBAR price fibonacci support zones are calculated based on the mathematical sequence discovered by Leonardo Fibonacci in the thirteenth century, where each number represents the sum of the two preceding numbers. Traders apply these ratios to identify potential reversal zones where price action typically finds support or encounters resistance.
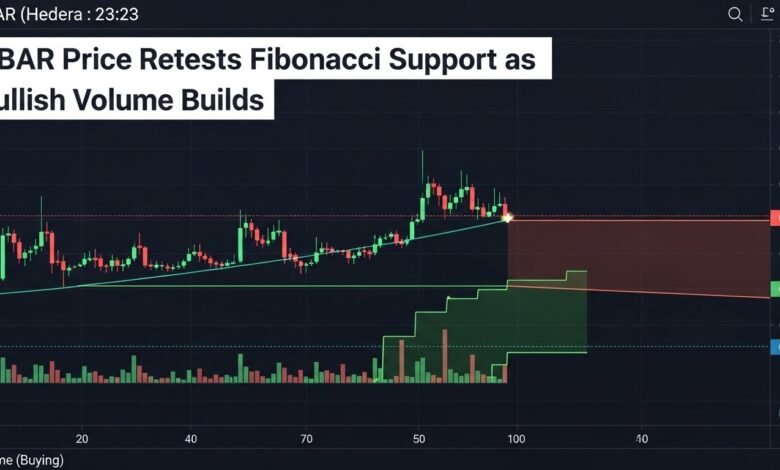
For Hedera Hashgraph price analysis, the most commonly observed fibonacci levels include the 38.2 percent, 50 percent, and 61.8 percent retracement zones. The current HBAR price action demonstrates textbook behavior as it approaches and tests the 61.8 percent fibonacci support level, which technical analysts often refer to as the golden ratio. This particular level has historically demonstrated remarkable reliability in cryptocurrency markets, frequently serving as the launching pad for sustained bullish reversals.
The mathematical precision of fibonacci analysis provides traders with objective entry and exit points, removing emotional decision-making from the trading equation. When HBAR technical indicators align with fibonacci support zones, the probability of a successful bounce increases substantially. The current retest of this critical support level, combined with emerging volume patterns, creates a confluence of bullish signals that seasoned traders recognize as high-probability setups.
Volume Analysis Signals Accumulation at Support Levels
Trading volume represents the lifeblood of price movements, and the recent surge in HBAR trading volume at fibonacci support levels tells a compelling story of institutional and retail accumulation. Volume analysis reveals that as the HBAR price descended toward the golden ratio support zone, buying pressure intensified dramatically, suggesting that sophisticated market participants view current valuations as attractive entry points for long-term positions.
The volume profile indicates several important developments that strengthen the bullish thesis for Hedera’s native token. On-chain metrics demonstrate that wallet addresses holding significant HBAR quantities have been steadily increasing their positions during this retracement phase, a behavior pattern typically associated with smart money accumulation. This divergence between price decline and volume increase creates what technical analysts call a bullish divergence, historically a precursor to significant upward price movements.
Furthermore, the cryptocurrency fibonacci retracement zones have witnessed sustained buying pressure rather than panic selling, indicating that market participants possess confidence in Hedera Hashgraph’s fundamental value proposition. The volume-weighted average price continues to hold above critical support thresholds, reinforcing the technical case for an imminent reversal. Exchange data reveals that HBAR withdrawals to private wallets have accelerated, reducing available supply on trading platforms and potentially setting the stage for a supply squeeze as demand continues building.
Technical Indicators Confirm Bullish Momentum Building
Beyond fibonacci analysis and volume metrics, a comprehensive examination of HBAR technical indicators reveals multiple signals suggesting that bullish momentum is coalescing at current price levels. The Relative Strength Index has climbed from oversold territory and now hovers in the neutral zone, indicating that selling pressure has exhausted itself while buying interest begins accumulating strength. This RSI behavior pattern frequently precedes sustained upward price movements in cryptocurrency markets.
The Moving Average Convergence Divergence indicator demonstrates increasing bullish divergence as the HBAR price tests support levels. The MACD histogram has begun printing progressively higher bars, suggesting that bearish momentum is waning while bullish forces gather strength. When combined with the fibonacci support retest, this MACD behavior creates a powerful confluence of technical signals that experienced traders recognize as high-probability entry opportunities.
Additionally, the Stochastic oscillator has completed a bullish crossover in oversold territory, a development that technical analysts interpret as an early warning signal of impending upward momentum. The convergence of multiple technical indicators at the HBAR price fibonacci support zone substantially increases the statistical probability of a successful bounce and subsequent rally. Market structure analysis reveals that higher lows are forming on lower timeframes, indicating that bulls are defending support levels with increasing conviction and capital commitment.
Hedera Network Fundamentals Support Price Recovery
While technical analysis provides valuable insights into short-term price movements, the fundamental developments within the Hedera network ecosystem provide the underlying rationale for sustained price appreciation beyond mere technical bounces. Hedera Hashgraph continues expanding its enterprise adoption footprint, with major corporations and government entities integrating the network’s distributed ledger technology into their operational infrastructure.
The Hedera Governing Council, which includes global enterprises such as Google, IBM, Boeing, and Deutsche Telekom, provides unparalleled legitimacy and stability to the network. This governance structure distinguishes Hedera from many competing blockchain platforms and creates a foundation for institutional confidence that translates into sustained demand for HBAR tokens. Recent announcements regarding expanded use cases in supply chain management, digital identity verification, and tokenization of real-world assets have strengthened the fundamental investment thesis for Hedera’s native cryptocurrency.
Transaction throughput on the Hedera network has reached new all-time highs, demonstrating that real-world utility is expanding alongside speculative interest. The network processes millions of transactions daily at near-zero costs and with exceptional speed, creating compelling value propositions for enterprises seeking efficient distributed ledger solutions. As more applications launch on Hedera and transaction volumes continue growing, the fundamental demand for HBAR price appreciation strengthens independent of short-term technical patterns.
Comparing HBAR Performance Against Broader Altcoin Markets
The altcoin price prediction landscape has evolved considerably as Bitcoin dominance fluctuates and capital rotates between different cryptocurrency sectors. HBAR price performance relative to other altcoins reveals important insights about market perception and positioning within the broader digital asset ecosystem. During recent market corrections, HBAR has demonstrated relative strength compared to many competing layer-one blockchain protocols, suggesting that market participants recognize its differentiated value proposition.
Comparative analysis reveals that Hedera Hashgraph has maintained more stable support levels than many altcoins with similar market capitalizations, indicating that long-term holders possess conviction in the project’s fundamental trajectory. This relative strength during bearish periods typically translates into outperformance during subsequent bullish phases, as capital flows disproportionately toward assets demonstrating resilience and accumulation patterns.
The correlation coefficient between HBAR price movements and broader altcoin market trends has decreased in recent months, suggesting that Hedera is beginning to establish independent price discovery based on project-specific developments rather than merely following general market sentiment. This decoupling behavior often precedes periods of significant outperformance, as the asset attracts attention from traders seeking opportunities beyond the standard high-correlation cryptocurrency holdings.
Key Support and Resistance Levels to Monitor
Identifying critical HBAR support levels and resistance zones provides traders with actionable roadmaps for position management and risk assessment. The fibonacci retracement analysis establishes the 61.8 percent level as the primary support zone, currently corresponding to a specific price range that has demonstrated consistent buying interest. Below this level, the 78.6 percent fibonacci extension represents the last line of defense before invalidating the current bullish thesis.
On the upside, resistance levels are equally important for establishing profit-taking targets and assessing breakout potential. The 50 percent fibonacci retracement level represents the first significant resistance zone that bulls must overcome to confirm reversal momentum. Successfully reclaiming this level would likely trigger cascading liquidations of short positions and attract momentum-based buying, potentially accelerating upward price movement toward the 38.2 percent retracement zone.
The psychological importance of round-number price levels cannot be understated in cryptocurrency trading, as these levels frequently act as magnets for profit-taking and new position establishment. Technical analysts monitoring HBAR price fibonacci support recognize that the interaction between mathematical fibonacci levels and psychological price points creates zones of enhanced significance where major directional decisions typically materialize. Traders establishing positions at current support levels generally place stop-loss orders below the 78.6 percent fibonacci extension to maintain favorable risk-reward ratios.
On-Chain Metrics Reveal Accumulation Patterns
Blockchain transparency allows market participants to analyze on-chain metrics that provide unique insights unavailable in traditional financial markets. The HBAR price trajectory can be better understood by examining wallet distribution patterns, exchange balances, and transaction characteristics that reveal the behavior of different market participant categories. Recent data demonstrates that addresses holding substantial HBAR quantities have been steadily increasing their positions, even as price action tests support levels.
Exchange balance metrics indicate that HBAR tokens are flowing away from centralized trading platforms toward private wallets and cold storage solutions, reducing immediately available supply for selling pressure. This pattern typically precedes supply shortages that can catalyze rapid price appreciation when demand increases. The ratio of exchange balances to total circulating supply has reached multi-month lows, creating structural conditions favorable for bullish price movements.
Network activity metrics reveal increasing transaction counts and active address growth, suggesting that actual utility and adoption are expanding alongside price consolidation. The combination of growing network usage with decreasing exchange supply creates a fundamental supply-demand imbalance that supports the technical case for HBAR price appreciation from current fibonacci support levels. Long-term holder metrics indicate that a significant portion of circulating supply has not moved in extended periods, demonstrating conviction among core supporters of the Hedera ecosystem.
Market Sentiment and Social Metrics Analysis
Quantifying market sentiment through social media analytics and community engagement metrics provides additional context for assessing the probability of successful rebounds from fibonacci support levels. Social volume surrounding Hedera Hashgraph has increased substantially as price tests support zones, indicating that the asset is capturing mindshare among cryptocurrency traders and investors. However, sentiment polarity remains balanced rather than euphoric, suggesting that excessive optimism has not yet entered the market psychology.
This measured sentiment profile creates favorable conditions for sustainable rallies rather than short-lived pumps driven by irrational exuberance. The absence of extreme fear or greed in sentiment indicators suggests that HBAR price may be approaching fair value ranges where fundamental buyers feel comfortable establishing positions for medium to long-term holding periods. Social metrics demonstrate increasing discussion quality, with technical analysis and fundamental research replacing speculative hype as the dominant conversation themes.
Search volume trends for terms related to Hedera network fundamentals and HBAR technical analysis have increased steadily, indicating growing awareness and research interest from potential new market participants. This expanding information-seeking behavior typically precedes capital allocation decisions, suggesting that the current consolidation phase may be accumulating potential energy for subsequent breakout movements. Community engagement across official channels and independent forums demonstrates healthy debate and analysis rather than cult-like promotion, indicating a maturing market participant base.
Institutional Interest and Enterprise Adoption Impact
The relationship between enterprise adoption and HBAR price performance deserves particular attention, as Hedera’s focus on institutional use cases differentiates it from purely retail-driven cryptocurrencies. Recent announcements regarding major corporations implementing Hedera-based solutions create fundamental demand drivers that operate independently of speculative trading dynamics. Each new enterprise integration potentially creates sustained token demand as transaction fees are paid in HBAR regardless of spot market price.
Institutional custody solutions for HBAR have expanded significantly, removing technical barriers that previously prevented large capital allocators from establishing positions. The availability of regulated custody through established financial services firms provides confidence for institutional investors who require specific safeguards and compliance frameworks. This infrastructure development creates pathways for substantial capital inflows that could dramatically impact HBAR trading volume and price discovery dynamics.
The tokenomics of Hedera include deliberate supply release schedules that prevent sudden inflation shocks while ensuring adequate liquidity for network operations. Understanding these supply dynamics helps traders contextualize price movements within the broader framework of planned token distribution. The current market conditions suggest that supply releases are being absorbed efficiently by fundamental demand, preventing the downward pressure that often accompanies unlocking events in other cryptocurrency projects.
Risk Factors and Potential Bearish Scenarios
Comprehensive analysis requires acknowledging potential risks and bearish scenarios that could invalidate the optimistic technical setup around HBAR price fibonacci support levels. Regulatory uncertainty continues affecting cryptocurrency markets broadly, and any adverse regulatory developments could create selling pressure regardless of project-specific fundamentals. Traders should maintain awareness of regulatory discussions in major jurisdictions and their potential impact on digital asset valuations.
Broader macroeconomic conditions, including monetary policy decisions, inflation trends, and traditional market performance, influence cryptocurrency prices through risk-on and risk-off capital flow dynamics. A significant deterioration in global economic conditions or unexpected monetary policy tightening could trigger widespread cryptocurrency selling that overwhelms technical support levels. Correlation with Bitcoin remains substantial across most altcoins, meaning that significant Bitcoin weakness could drag HBAR price lower despite strong project-specific fundamentals.
Technical invalidation signals include decisive breaks below the 78.6 percent Fibonacci extension with sustained trading volume, which would suggest that current support assumptions were premature and further downside may materialize. Traders employing Fibonacci analysis strategies typically establish clear invalidation points where they exit positions to preserve capital for better opportunities. The absence of volume accompanying any potential breakdown would provide some comfort that selling pressure lacks conviction, but decisive breaks on high volume warrant defensive positioning adjustments.
Trading Strategies for Current Market Conditions
Developing actionable trading strategies around the HBAR price, the fibonacci support retest requires balancing opportunity recognition with prudent risk management. Conservative traders might wait for confirmation of the bounce through higher timeframe candle closes above key Fibonacci levels before establishing positions, sacrificing some potential gains for increased probability of success. This approach reduces exposure to false breakouts and whipsaw price action that can trigger premature stop-loss orders.
More aggressive traders may scale into positions throughout the support zone, averaging their entry prices and reducing the impact of short-term volatility on overall position profitability. This strategy requires larger capital reserves and strong conviction in the technical and fundamental analysis supporting the bullish thesis. Position sizing becomes critical, as overleveraging during consolidation phases can result in forced liquidations before the anticipated move materializes.
Risk management protocols should include predetermined stop-loss levels below technical invalidation points, position sizing that limits individual trade risk to acceptable percentages of trading capital, and profit-taking strategies that secure gains as price reaches resistance levels. The HBAR technical indicators confluence suggests favorable risk-reward ratios for well-structured positions, but disciplined execution remains essential for long-term trading success. Traders should document their analysis, entry reasoning, and exit criteria to facilitate continuous improvement of their analytical and execution frameworks.
Long-Term Outlook and Price Targets
Projecting long-term price targets for HBAR requires synthesizing technical analysis with fundamental growth trajectories and broader cryptocurrency market development. If the current Fibonacci support holds and initiates a reversal, initial targets would include reclaiming the 50 percent and 38.2 percent retracement levels, representing substantial percentage gains from current prices. These targets align with previous consolidation zones that may now serve as resistance requiring multiple tests before breakthrough.
Extended price targets based on Fibonacci extension levels project potential upside toward previous all-time high ranges and beyond, contingent on sustained bullish momentum and favorable market conditions. The realization of these ambitious targets depends on multiple factors, including continued enterprise adoption, expanding network utility, favorable regulatory developments, and general cryptocurrency market strength. Altcoin price prediction models incorporating network growth metrics and tokenomics suggest that HBAR possesses fundamental characteristics supporting substantial long-term appreciation.
The timeline for achieving various price targets remains inherently uncertain, as cryptocurrency markets frequently experience extended consolidation periods followed by rapid appreciation phases. Patient capital with extended investment horizons may benefit most from current accumulation opportunities, while shorter-term traders should remain flexible and responsive to evolving technical conditions. The intersection of strong fundamentals with technical support creates conditions where both trading and investment approaches can potentially achieve favorable outcomes.
Conclusion
The current HBAR price fibonacci support retest represents a confluence of technical and fundamental factors that create compelling opportunities for market participants with appropriate risk tolerance and analytical frameworks. The building bullish volume, supportive technical indicators, expanding network fundamentals, and favorable accumulation patterns collectively suggest that current price levels may represent attractive entry points for positions aligned with medium to long-term appreciation potential.
Successful navigation of cryptocurrency markets requires combining rigorous technical analysis with fundamental research, prudent risk management, and emotional discipline during periods of uncertainty. The Hedera Hashgraph ecosystem continues demonstrating real-world utility and enterprise adoption that distinguishes it within the crowded blockchain landscape, providing fundamental support for HBAR price appreciation beyond mere speculative interest.
As the cryptocurrency market evolves and matures, projects with genuine utility, credible governance structures, and expanding adoption will likely emerge as sustainable value propositions. The current technical setup suggests that HBAR is positioning for its next major move, and traders monitoring Fibonacci support levels are witnessing a potentially historic accumulation opportunity unfold in real-time.
See more: Bitcoin OG Owen Gunden Deposits Final 2,499 BTC ($228M) to Kraken – Details